The car characteristics has had a layout change, it has had to be turned though 90 degrees, the data is exactly the same, when data is entered into the table graphics will automatically display.
Example Hennessey Venom GT:
Old Layout
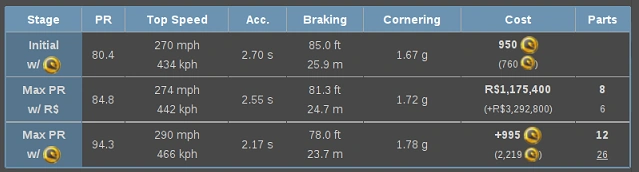
The data is displayed as a table of numbers, it's difficult to visually see how good, or bad these numbers are.
New Layout
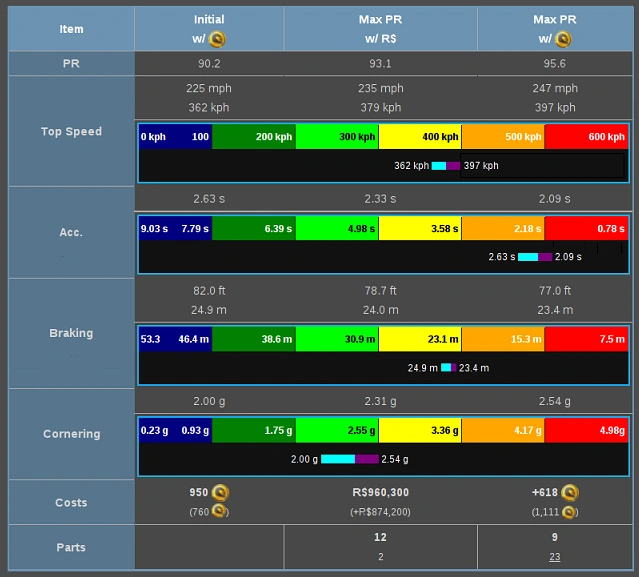
The new layout turns the existing data though 90 degrees and the data is displayed in a bar, it is much easier to see the car is very fast accelerating and high top speed, with relatively poor grip.
There is no difference to the data.
Hybrid Layout
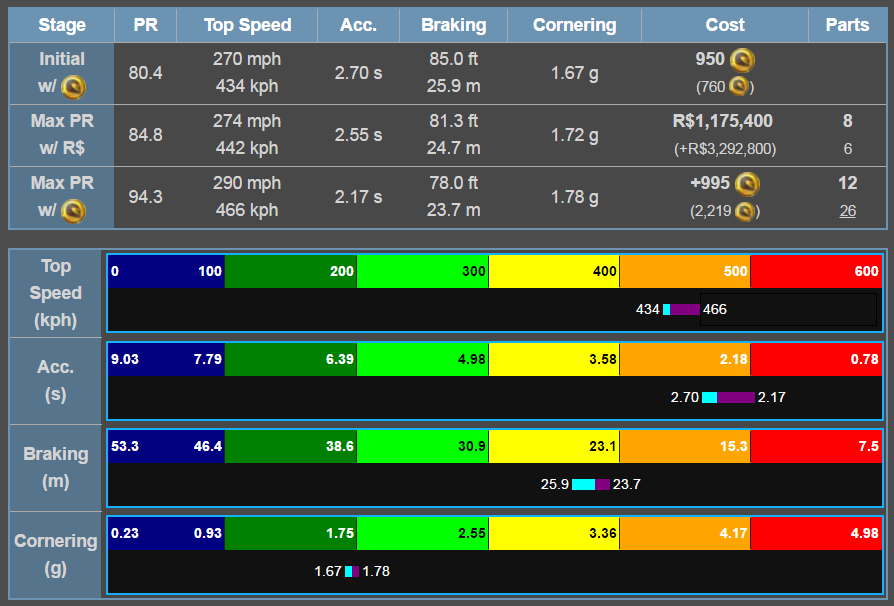
Following the feedback from the community, the template has been changed back to the original, I have now added the graphics underneath, a hybrid. I believe this answers most of the feedback.
There is no difference to the data.
RR3 Michael P (talk) 15:13, December 10, 2016 (UTC)
Edit: Added Hybrid RR3 Michael P (talk) 09:55, December 11, 2016 (UTC)


